
For best results, configure your Call Scoring playbook before relying on qualitative metrics. Scores and Playbook Analysis data are only as meaningful as the criteria you’ve defined.
Filtering Reports
All reports share the same set of filters at the top of the page:- Meeting Type — focus on specific types of call (e.g. Discovery, Demo, QBR).
- Date range — narrow results to a specific period.
- Internal vs. external — separate internal meetings (all attendees from your domain) from customer-facing calls.
- Team member — view data for one or more reps, or the whole team.
- Activity type — narrow results to Video Call, Calls, WhatsApp, or Audio Note.
Overview Report
The Overview report combines quantitative activity metrics with qualitative quality signals, giving you a complete picture of call volume and effectiveness side by side.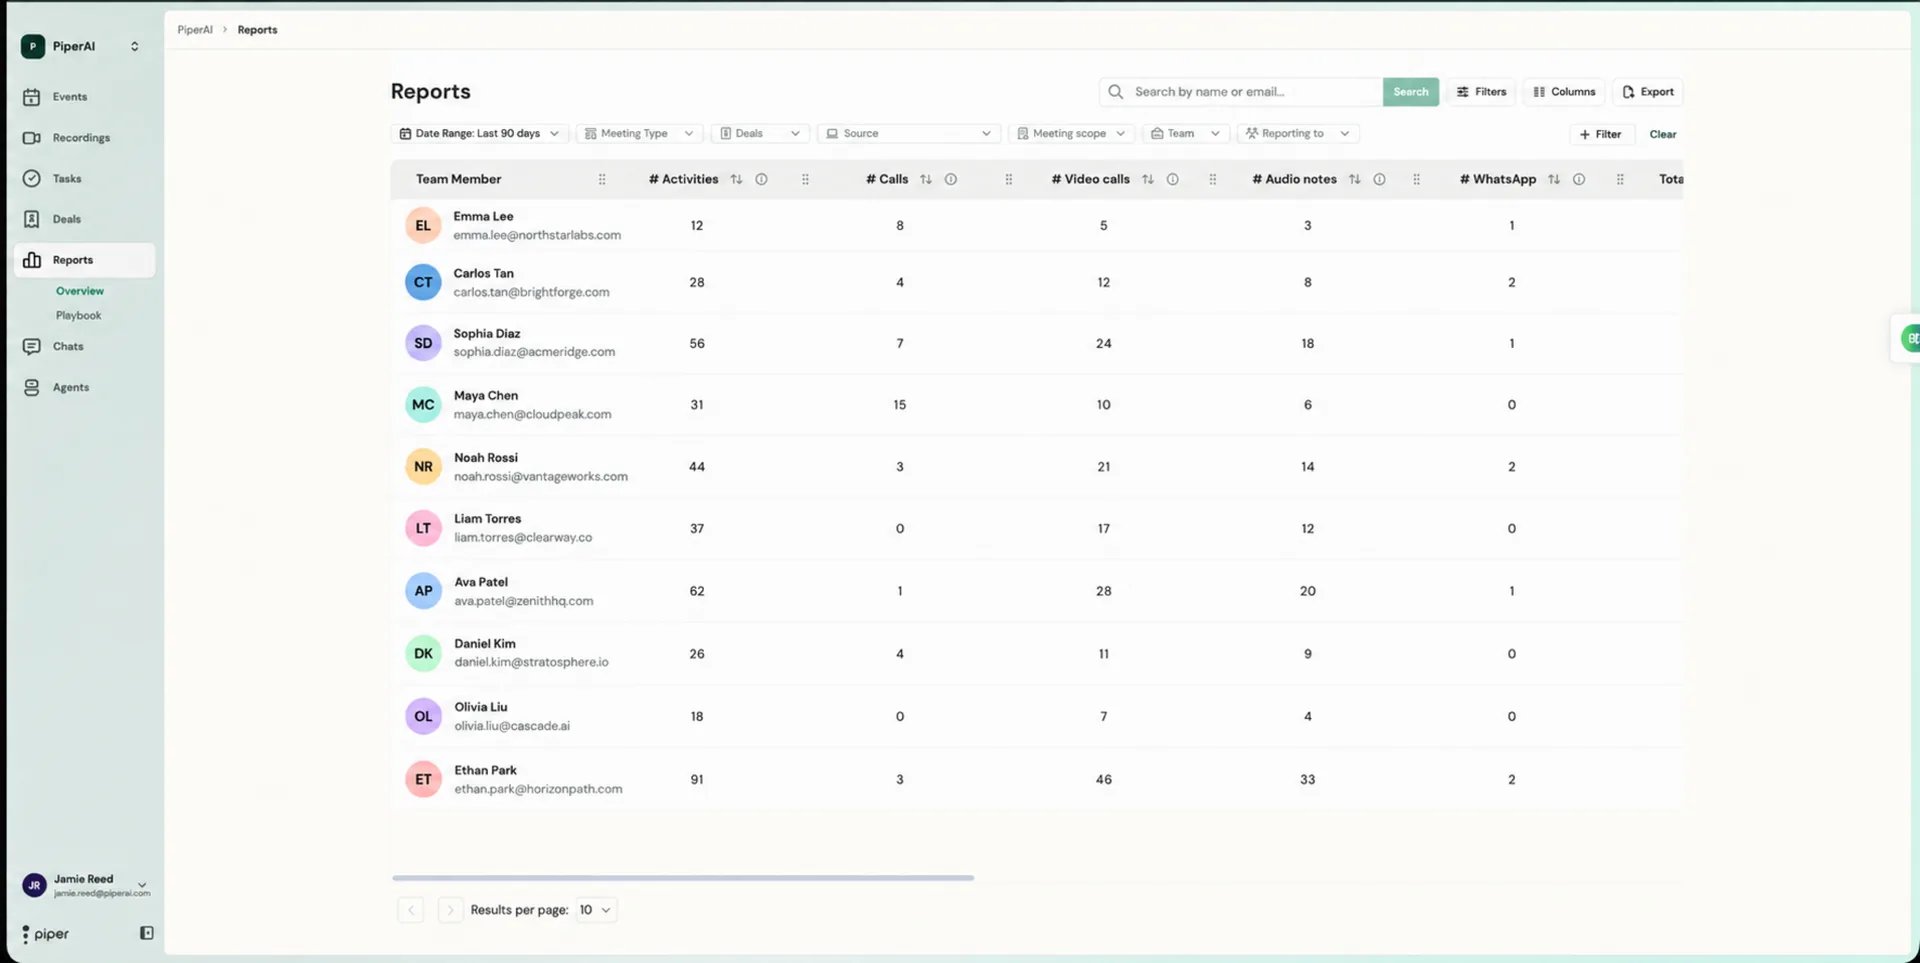
Quantitative metrics
Qualitative metrics
How these metrics are calculated
Why Total Talk Time is usually lower than Total Duration
Why Total Talk Time is usually lower than Total Duration
Total Duration spans the whole call, from the first word to the last, no matter how many people were on it. Total Talk Time only adds up the moments someone was actually speaking — so pauses, dead air, or anyone on mute aren’t counted. A slower, more thoughtful call can end up with a much lower Total Talk Time relative to its Total Duration than a fast-paced one.
Why the averages only count recorded activities
Why the averages only count recorded activities
Avg Duration and Avg Talk Time divide by the number of activities that actually produced a recording — not the total number logged. An activity that was scheduled or logged but never recorded (a call nobody joined, or one you chose not to record) doesn’t drag these averages down.
Understanding talk-to-listen ratio
The talk-to-listen ratio tells you what share of each call the rep was speaking. It appears in the Overview report and on individual Transcription pages.How to interpret talk-to-listen ratio
How to interpret talk-to-listen ratio
A high talk-to-listen ratio — for example, a rep speaking 80% of the time during a discovery call — can be a signal that they’re not asking enough questions or giving prospects enough room to share their challenges.Use this metric to:
- Identify reps who may be pitching too early in the sales cycle.
- Compare ratios across meeting types (e.g. demos naturally have higher rep talk time than discovery calls).
- Track individual improvement over time after coaching.
Playbook Analysis Report
The Playbook Analysis report breaks down how well each rep is executing against your defined playbook — section by section, call by call, and rep by rep.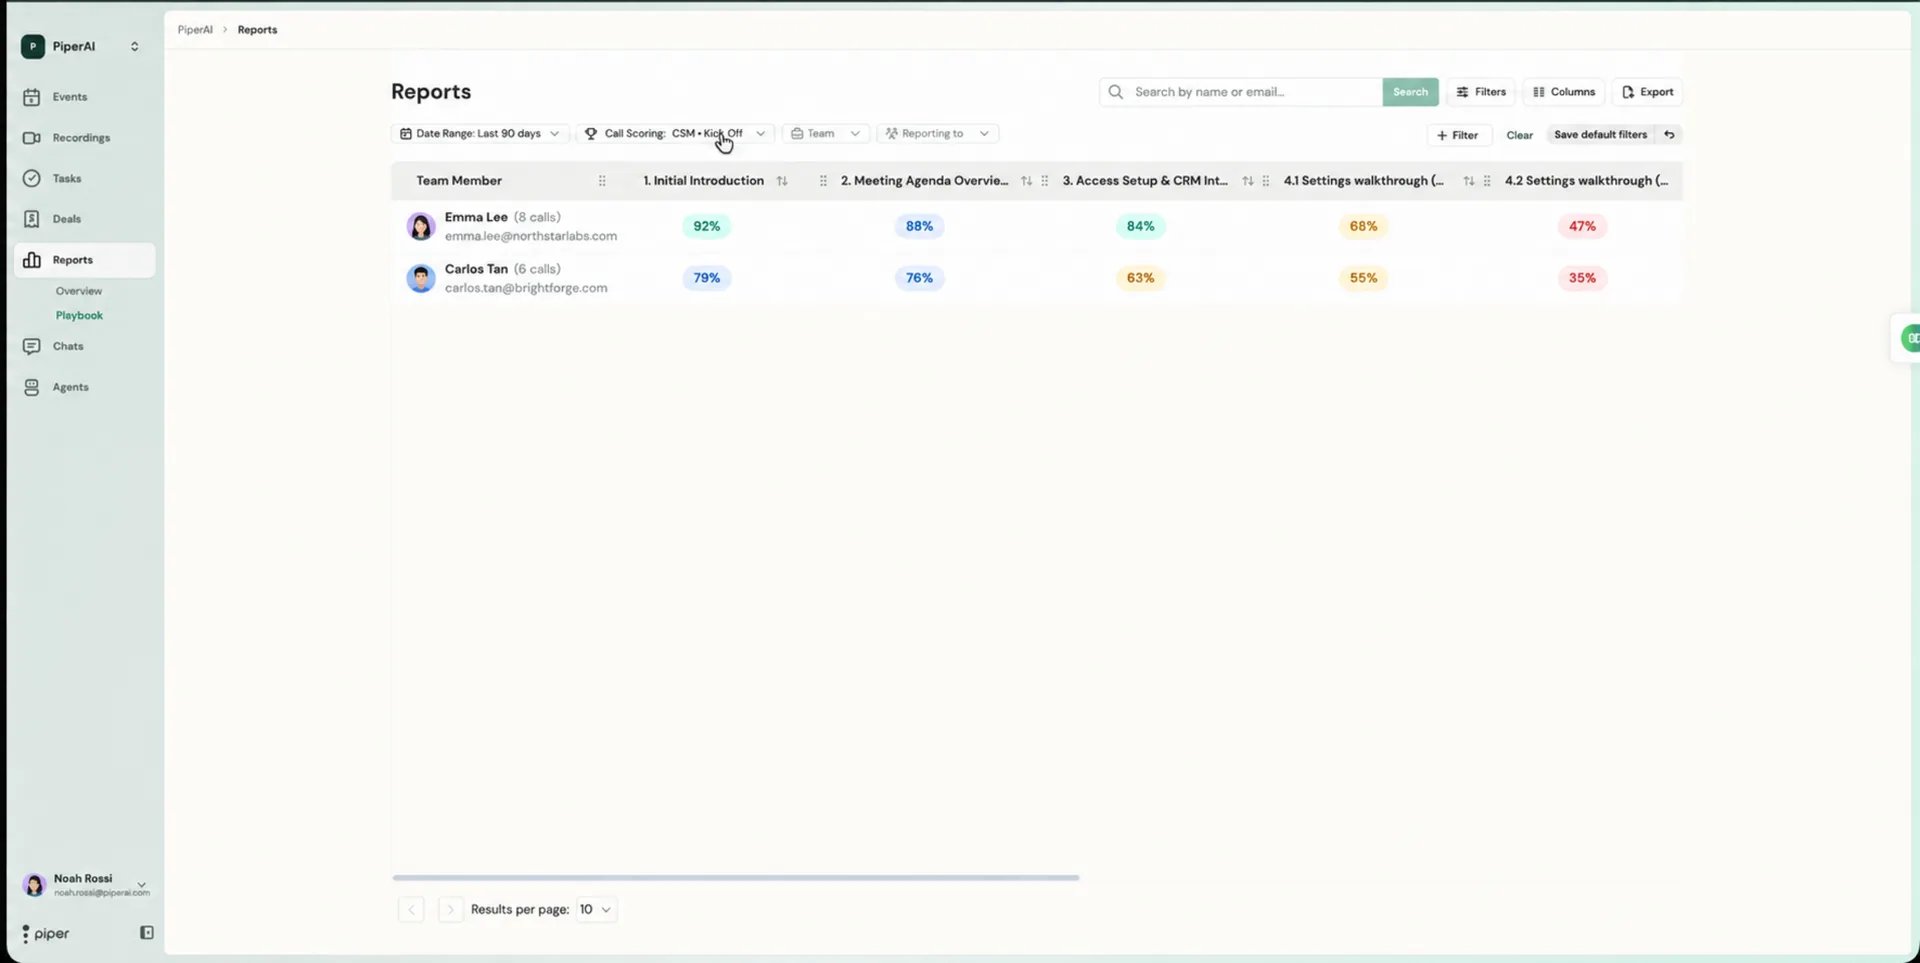
What it shows
- Individual call scores — the playbook score for each recorded meeting.
- Average scores by section — how the team performs on each part of the playbook on average, revealing which areas consistently under-deliver.
- Per-rep breakdowns — scores aggregated by individual team member so you can compare performance across the team.
Using Playbook Analysis for coaching
Find the weakest sections
Sort by average section score to identify which parts of the playbook the team consistently struggles with — these are your highest-leverage coaching opportunities.
Spot underperforming reps
Filter by team member to surface reps whose scores are consistently below the team average across one or more playbook sections.
Compare top performers
Look at the highest-scoring reps for a given section to understand what great looks like — then use those calls as examples in team coaching sessions.
Track improvement over time
Use the date range filter to compare a rep’s scores before and after coaching to measure whether the feedback is landing.
View Options
Switch between two views using the controls at the top of the report:- Table view — a structured grid of calls and metrics, ideal for sorting and comparing data across reps and time periods.
- Gallery view — meeting cards with key metrics displayed visually, useful for quickly scanning individual calls and spotting patterns.
Coming Soon
Coaching Reports are currently in development and will be available in a future release. This dedicated report will provide deeper insights for sales managers focused on rep development and onboarding.